At the beginning of 2019, Vectioneer was tasked with designing a comprehensive machine monitoring system for FiberXL (formerly known as Eurofibers). The company was interested in tracking the running times of their winding and coating machines to optimize efficiency and maintenance schedules. The objective was to create a system that would provide clear, accessible data for monitoring and analyzing machine performance.
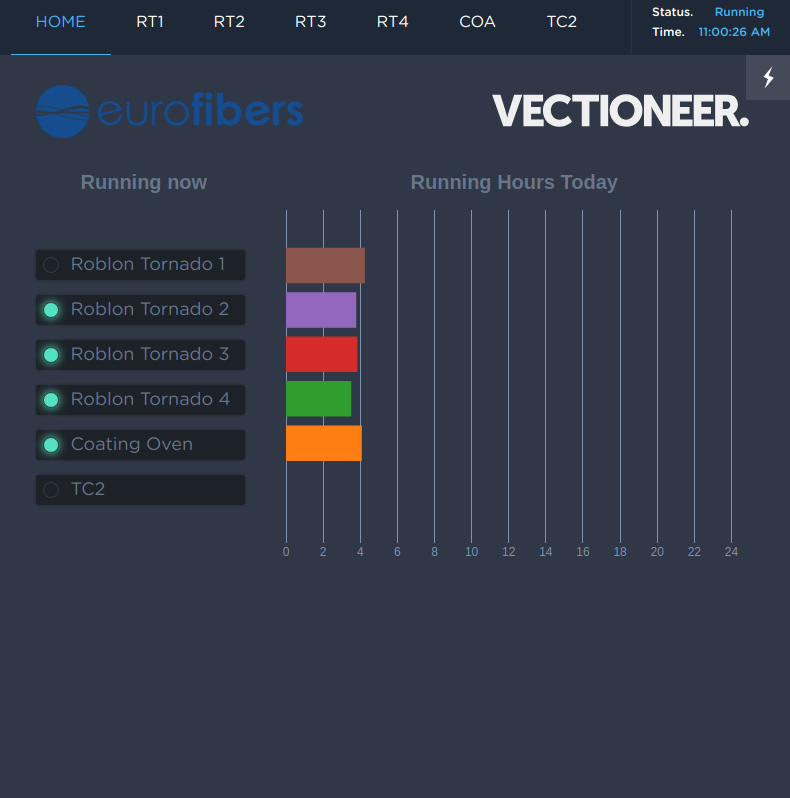
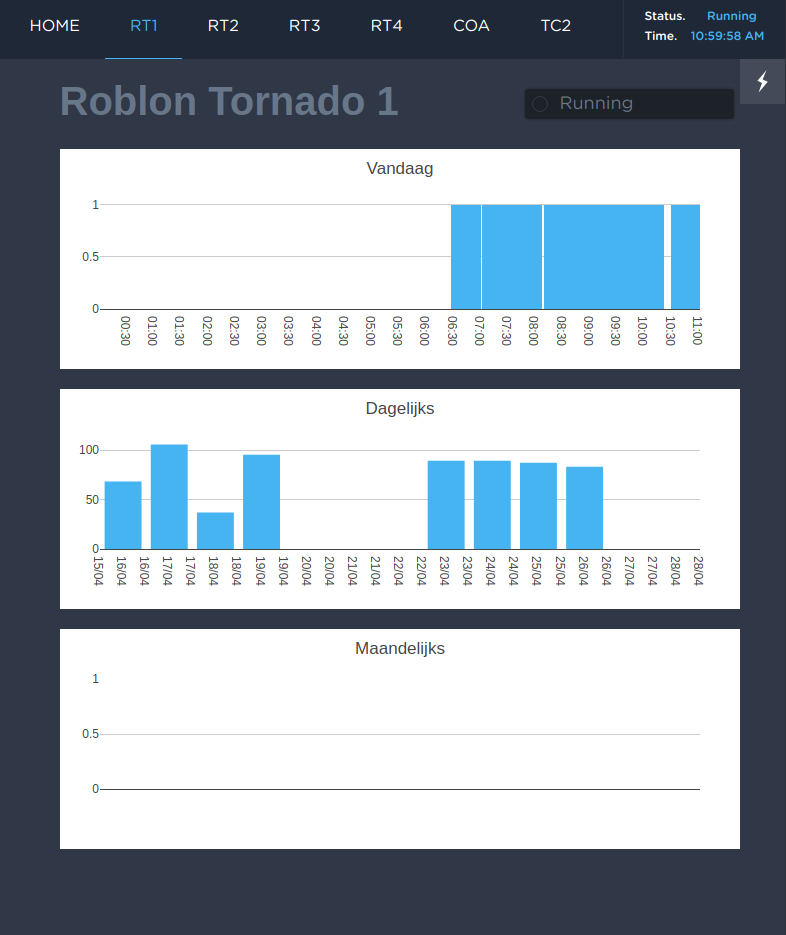
Vectioneer’s team thoroughly examined the machines to identify useful signals that could be captured and transformed into meaningful graphs. Using Python and Vectioneer’s proprietary Grid tool, they developed visual representations of the machines’ running times, which were categorized by hourly, daily, and monthly intervals. These graphs allowed FiberXL to easily monitor their equipment and identify trends over time, improving overall operational awareness.
Project
Machine Motoring Kit
Client
Eurofibers
What We Did
Retrofitting + upgrading Hard- & Software
Optimizing Efficiency with Real-Time Insights
As an additional benefit, Vectioneer ensured that the monitoring system was fully accessible online. FiberXL’s team could view real-time data through a browser interface, providing greater flexibility and convenience. To support deeper analysis, users were also able to download the collected data in .CSV format, enabling detailed, offline review and decision-making.